NetworkX 系列教程 (2)-graph 生成器

本节主要讲解如何快速使用内置的方法生成 graph, 官方的文档在这里 , 里面包含了 networkX 的所有 graph 生成器,下面的内容只是我节选的内容,并将 graph 画出来而已.

声明,文中重复使用了以下代码块,现在统一注释在这里:

1
2
3
4
5
6
plt.subplot(221)  #生成2*2的组图,并且当前子图在2*2矩阵的第一个位置.第二个位置是222
plt.title('complete_graph') #子图的标题
nx.draw(G, with_labels=True, font_weight='bold') #将graph画出来
plt.axis('on') #需要坐标轴,以便框住graph
plt.xticks([]) #横坐标不需要刻度
plt.yticks([]) #纵坐标不需要刻度

注意如果代码出现找不库,请返回第一个教程,把库文件导入.

生成 graph

小图图集的生成器

1
2
3
4
5
6
7
8
9
10
11
12
13
14
15
16
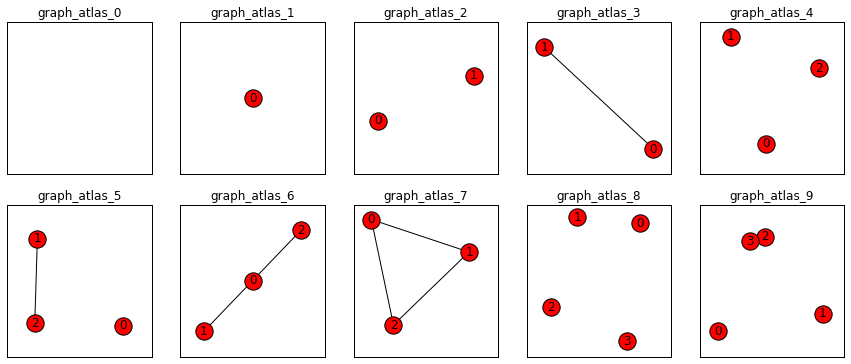
#graph_atlas的图已经被定义,只需要按标号取出来就可以,下面将前10个取出来
plt.subplots(2,5,figsize=(15,6))
for ind in range(10):
G.clear()

G=nx.graph_atlas(ind)
plt.subplot(2,5,ind+1)
nx.draw(G,with_labels=True)

#下面是设置图片
plt.axis('on')
plt.title('graph_atlas_%s'%ind)
plt.xticks([])
plt.yticks([])
plt.show()
plt.close()

png

调用函数生成经典的 graph

1
2
3
4
5
6
7
8
9
10
11
12
13
14
15
16
17
18
19
20
21
22
23
24
25
26
27
28
29
30
31
32
33
34
35
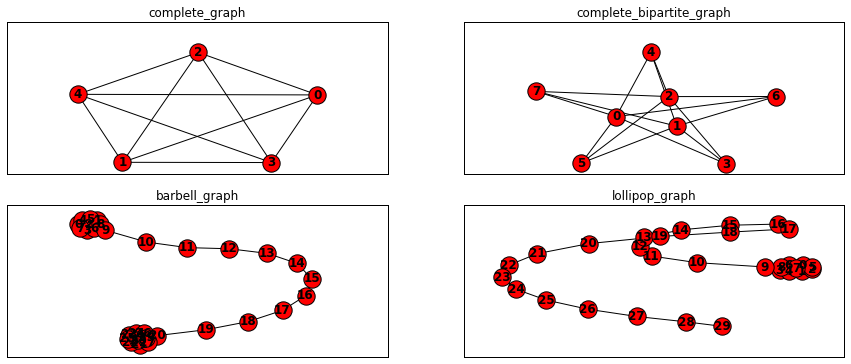
plt.subplots(2,2,figsize=(15,6))

K_5 = nx.complete_graph(5)
plt.subplot(221)
plt.title('complete_graph')
nx.draw(K_5, with_labels=True, font_weight='bold')
plt.axis('on')
plt.xticks([])
plt.yticks([])

K_3_5 = nx.complete_bipartite_graph(3, 5)
plt.subplot(222)
plt.title('complete_bipartite_graph')
nx.draw(K_3_5, with_labels=True, font_weight='bold')
plt.axis('on')
plt.xticks([])
plt.yticks([])

barbell = nx.barbell_graph(10, 10)
plt.subplot(223)
plt.title('barbell_graph')
nx.draw(barbell, with_labels=True, font_weight='bold')
plt.axis('on')
plt.xticks([])
plt.yticks([])

lollipop = nx.lollipop_graph(10, 20)
plt.subplot(224)
plt.title('lollipop_graph')
nx.draw(lollipop, with_labels=True, font_weight='bold')
plt.axis('on')
plt.xticks([])
plt.yticks([])

plt.show()

png

格子 graph

1
2
3
4
5
6
7
8
9
10
11
12
13
14
15
16
17
18
19
20
21
22
23
24
25
26
27
28
29
30
31
32
33
34
35
36
37
38
39
40
41
42
43
44
45
46
47
48
49
G.clear()

plt.subplots(2,3,figsize=(15,6))
#二维网格图
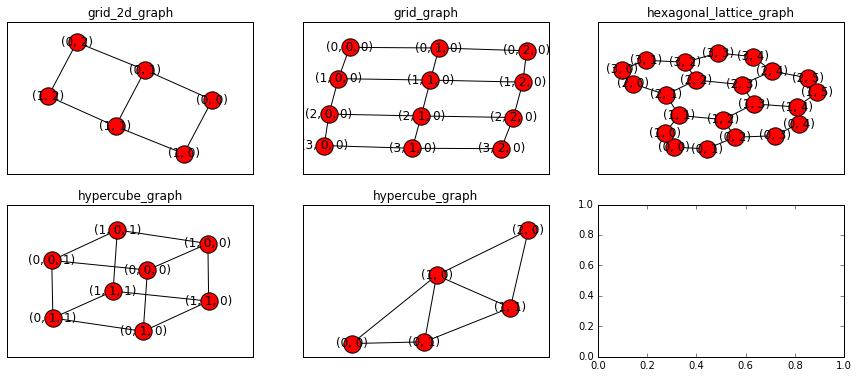
G=nx.grid_2d_graph(2,3)
plt.subplot(2,3,1)
nx.draw(G,with_labels=True)
plt.title('grid_2d_graph')
plt.axis('on')
plt.xticks([])
plt.yticks([])

#n维网格图
grid_graph = nx.grid_graph(dim=[1, 3, 4])
plt.subplot(2,3,2)
nx.draw(grid_graph,with_labels=True)
plt.title('grid_graph')
plt.axis('on')
plt.xticks([])
plt.yticks([])

#m×n的六角形格子图。
G=nx.hexagonal_lattice_graph(2,3)
plt.subplot(2,3,3)
nx.draw(G,with_labels=True)
plt.title('hexagonal_lattice_graph')
plt.axis('on')
plt.xticks([])
plt.yticks([])

#n维超立方体图形。
G=nx.hypercube_graph(3)
plt.subplot(2,3,4)
nx.draw(G,with_labels=True)
plt.title('hypercube_graph')
plt.axis('on')
plt.xticks([])
plt.yticks([])

#三角格子图
G=nx.triangular_lattice_graph(1,3)
plt.subplot(2,3,5)
nx.draw(G,with_labels=True)
plt.title('hypercube_graph')
plt.axis('on')
plt.xticks([])
plt.yticks([])

plt.show()

png

各种已经被命名的小 graph

1
2
3
4
5
6
7
8
9
10
11
12
13
14
15
16
17
18
19
20
21
22
23
24
25
26
27
28
29
30
31
32
33
34
35
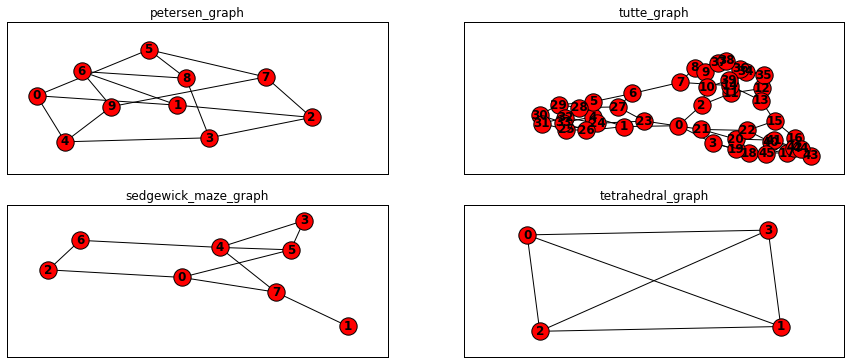
plt.subplots(2,2,figsize=(15,6))

petersen = nx.petersen_graph()
plt.subplot(221)
plt.title('petersen_graph')
nx.draw(petersen, with_labels=True, font_weight='bold')
plt.axis('on')
plt.xticks([])
plt.yticks([])

tutte = nx.tutte_graph()
plt.subplot(222)
plt.title('tutte_graph')
nx.draw(tutte, with_labels=True, font_weight='bold')
plt.axis('on')
plt.xticks([])
plt.yticks([])

maze = nx.sedgewick_maze_graph()
plt.subplot(223)
plt.title('sedgewick_maze_graph')
nx.draw(maze, with_labels=True, font_weight='bold')
plt.axis('on')
plt.xticks([])
plt.yticks([])

tet = nx.tetrahedral_graph()
plt.subplot(224)
plt.title('tetrahedral_graph')
nx.draw(tet, with_labels=True, font_weight='bold')
plt.axis('on')
plt.xticks([])
plt.yticks([])

plt.show()

png

使用随机 graph 生成器

1
2
3
4
5
6
7
8
9
10
11
12
13
14
15
16
17
18
19
20
21
22
23
24
25
26
27
28
29
30
31
32
33
34
35
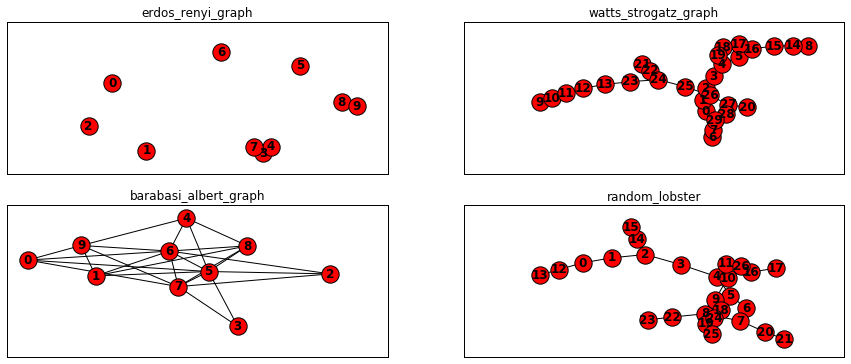
plt.subplots(2,2,figsize=(15,6))

er = nx.erdos_renyi_graph(10, 0.15)
plt.subplot(221)
plt.title('erdos_renyi_graph')
nx.draw(er, with_labels=True, font_weight='bold')
plt.axis('on')
plt.xticks([])
plt.yticks([])

ws = nx.watts_strogatz_graph(30, 3, 0.1)
plt.subplot(222)
plt.title('watts_strogatz_graph')
nx.draw(ws, with_labels=True, font_weight='bold')
plt.axis('on')
plt.xticks([])
plt.yticks([])

ba = nx.barabasi_albert_graph(10, 5)
plt.subplot(223)
plt.title('barabasi_albert_graph')
nx.draw(ba, with_labels=True, font_weight='bold')
plt.axis('on')
plt.xticks([])
plt.yticks([])

red = nx.random_lobster(10, 0.9, 0.9)
plt.subplot(224)
plt.title('random_lobster')
nx.draw(red, with_labels=True, font_weight='bold')
plt.axis('on')
plt.xticks([])
plt.yticks([])

plt.show()

png

社交网络

1
2
3
4
5
6
7
8
9
10
11
12
13
14
15
16
17
18
19
20
21
22
23
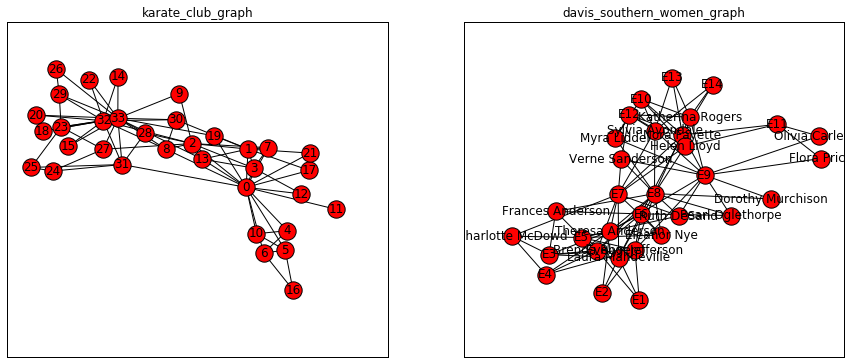
plt.subplots(2,2,figsize=(15,6))

#返回Zachary的空手道俱乐部图。
G.clear()
G = nx.karate_club_graph()
plt.subplot(1,2,1)
nx.draw(G,with_labels=True)
plt.title('karate_club_graph')
plt.axis('on')
plt.xticks([])
plt.yticks([])

#戴维斯南方女性社交网络。
G.clear()
G = nx.davis_southern_women_graph()
plt.subplot(1,2,2)
nx.draw(G,with_labels=True)
plt.title('davis_southern_women_graph')
plt.axis('on')
plt.xticks([])
plt.yticks([])

plt.show()

png

社区

1
2
3
4
5
6
7
8
9
10
11
12
13
14
15
16
17
18
19
20
21
22
23
24
25
26
27
28
29
30
31
32
33
34
35
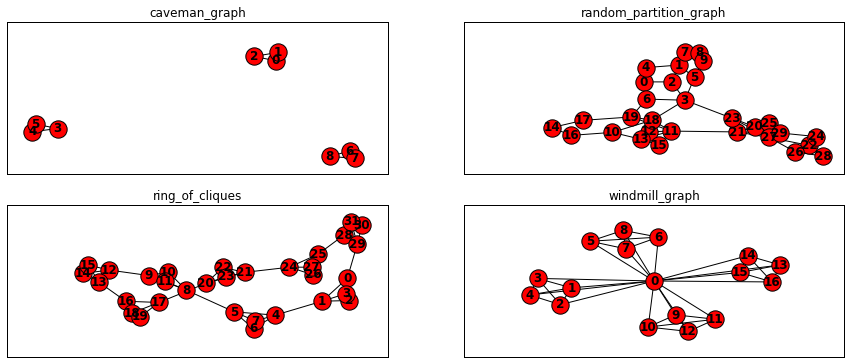
plt.subplots(2,2,figsize=(15,6))

er = nx.caveman_graph(3,3)
plt.subplot(221)
plt.title('caveman_graph')
nx.draw(er, with_labels=True, font_weight='bold')
plt.axis('on')
plt.xticks([])
plt.yticks([])

ws = nx.random_partition_graph([10,10,10],.25,.01)
plt.subplot(222)
plt.title('random_partition_graph')
nx.draw(ws, with_labels=True, font_weight='bold')
plt.axis('on')
plt.xticks([])
plt.yticks([])

ba = nx.ring_of_cliques(8, 4)
plt.subplot(223)
plt.title('ring_of_cliques')
nx.draw(ba, with_labels=True, font_weight='bold')
plt.axis('on')
plt.xticks([])
plt.yticks([])

red = nx.windmill_graph(4,5)
plt.subplot(224)
plt.title('windmill_graph')
nx.draw(red, with_labels=True, font_weight='bold')
plt.axis('on')
plt.xticks([])
plt.yticks([])

plt.show()

png

1
2
3
4
5
6
7
8
9
10
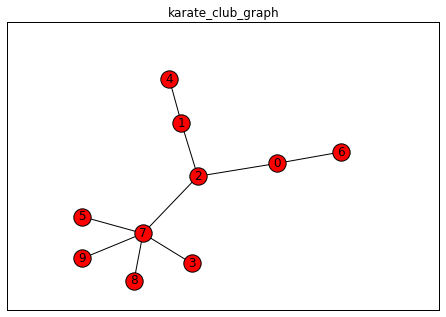
#返回随机树
G.clear()
G = nx.random_tree(10)
nx.draw(G,with_labels=True)
plt.title('random_tree')
plt.axis('on')
plt.xticks([])
plt.yticks([])

plt.show()

png